Running and debugging
Local Desktop runs on a phone, but you write it on a computer. This page shows the setup we use every day: build, install and debug on a real device with one key, and read its logs in the editor.
Recommended setup:
-
IDE: Visual Studio Code (Cursor and VSCodium work too)
-
Extensions:
- Rust Analyzer
- Local Desktop Dev, the project's own extension. Its source lives in
vscode-extension/. Install it from Open VSX (in VS Code, download the.vsixand use Install from VSIX), or run it from source: open thevscode-extension/folder and press F5 (see Using the maintainer tools). - CodeLLDB 1.11.4 or newer, which Local Desktop Dev uses for breakpoints.
Run Local Desktop: Check Environment from the Command Palette once. It checks adb, the Android SDK, Gradle, Java, the patched xbuild, the Rust target, lldb-server and scrcpy, and tells you how to fix anything that's missing.
How to debug
- Connect a phone with USB debugging enabled, or pair one over Wi‑Fi (see below). The device shows up in the Local Desktop sidebar under Devices, and in the status bar. Click either to choose a device when several are connected.
- Press F5 (or launch
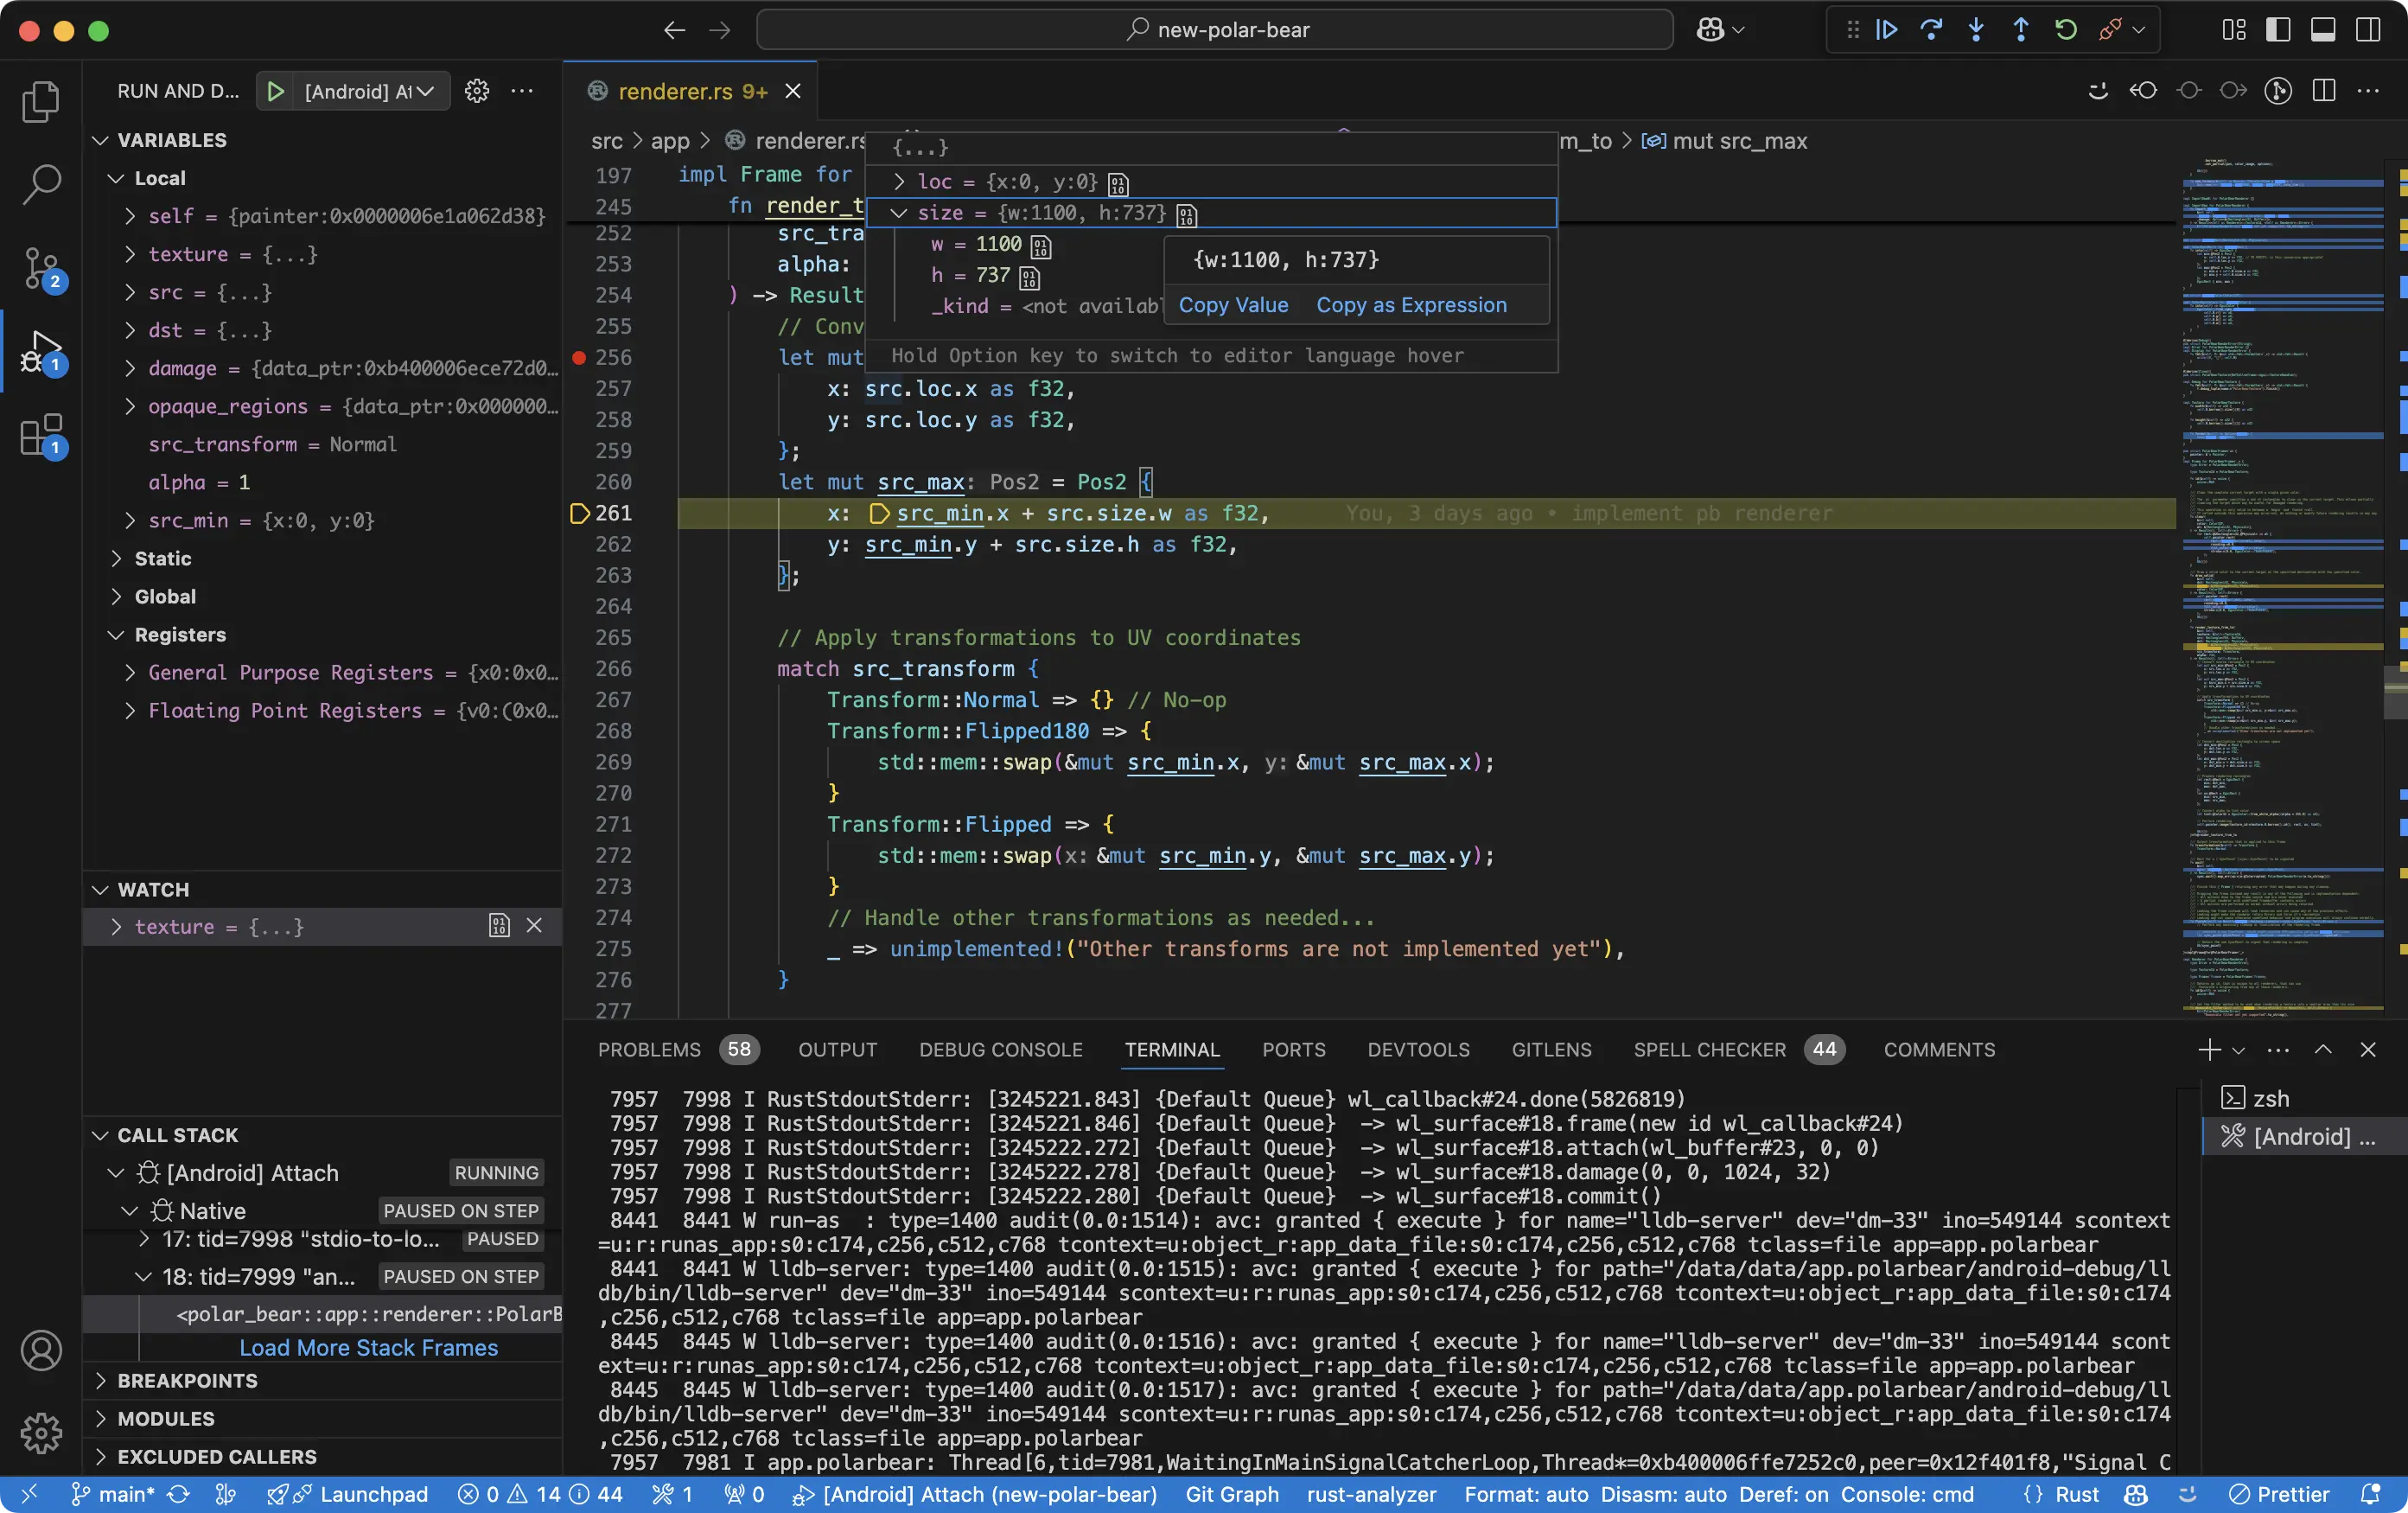
Local Desktop: Debug on Androidfrom the Run and Debug panel). This will:- Build the debug APK with xbuild. Compile errors land in the Problems view.
- Install it on the selected device (skipped when the APK hasn't changed).
- Launch the app waiting for the debugger, attach LLDB inside the app's sandbox, then let the app continue.
- Mirror the app's stdout/stderr, warnings and errors into the Debug Console.
- Set breakpoints anywhere in the Rust code, even in
android_maininsrc/android/main.rs: they bind as soon asliblocaldesktop.sois loaded.
If the session stops with "No arm64 lldb-server found", see Debugger can't find lldb-server.
Other ways to run:
- Ctrl + F5 builds, installs and starts the app without the debugger. Stopping the session stops the app.
Local Desktop: Attach to Running Appattaches to a process that's already running: the app itself, or one of its children such as proot or PipeWire.- In
.vscode/launch.jsonyou can set"device": "pick"to always choose a device,"build": falseto reuse the last APK,"stopOnEntry": true, or"lldbServerLog": trueto troubleshoot the debugger.
Tip: You can debug the app on a physical device or on an arm64 emulator. Emulators that translate arm64 code on an x86_64 image can only run the app, not debug it.
Wireless debugging
Android 11 and newer can be debugged over Wi‑Fi, with the phone and computer on the same network:
- Pair Device over Wi‑Fi (QR Code): on the phone, open Developer options > Wireless debugging > Pair device with QR code and scan the code the extension shows.
- Pair Device over Wi‑Fi (Pairing Code): enter the IP address, port and six-digit code from Pair device with pairing code.
- Connect to Device over Wi‑Fi: reconnect to a phone you've paired before.
- Switch USB Device to Wi‑Fi: the classic
adb tcpip 5555switch for older phones; plug in once, then unplug.
How to view the logs
The Local Desktop Logcat output panel streams everything the app's process logs: Rust stdout/stderr (including panics), log:: messages, and the proot and PipeWire child processes. Open it with Local Desktop: Show Logcat, or from the Devices view. Local Desktop: Filter Logcat narrows it by level or regex.
When something goes wrong, look for E lines and RustStdoutStderr lines first. A panic looks like thread '<unnamed>' panicked at src/..., followed by the message. For example, when the GPU driver can't give the compositor an OpenGL ES context, the screen stays black and the logcat says why:
E localdesktop::android:: Failed to initialize Wayland renderer on resume: Failed to create EGLContext. Tried: OpenGL ES 3.0 with 8-bit hardware-accelerated surface: ... | OpenGL ES 2.0 with 8-bit emulator-friendly surface: ...
See Reading the logs for what each tag means, and the Bug cheat sheet for this particular error.
Every line is also saved to .localdesktop/logs/logcat.log in the repository, which is handy for sharing logs or for coding agents to read.
Without the extension, run the [Android] Logcat task, or follow Reading the logs.
With a coding agent
The repository ships an MCP server with the same device tools (build, install, screenshot, tap, type, logcat, crash reports, audio checks), so Claude Code, Cursor or Codex can run the app and see the result by themselves. AGENTS.md at the root of the repository explains how to connect it, and Using the maintainer tools lists every tool.